 AIRPORT
  AIRGEST

 PARKING - Buy online
LATEST-RESULTS
Passenger traffic data for the year 2025:
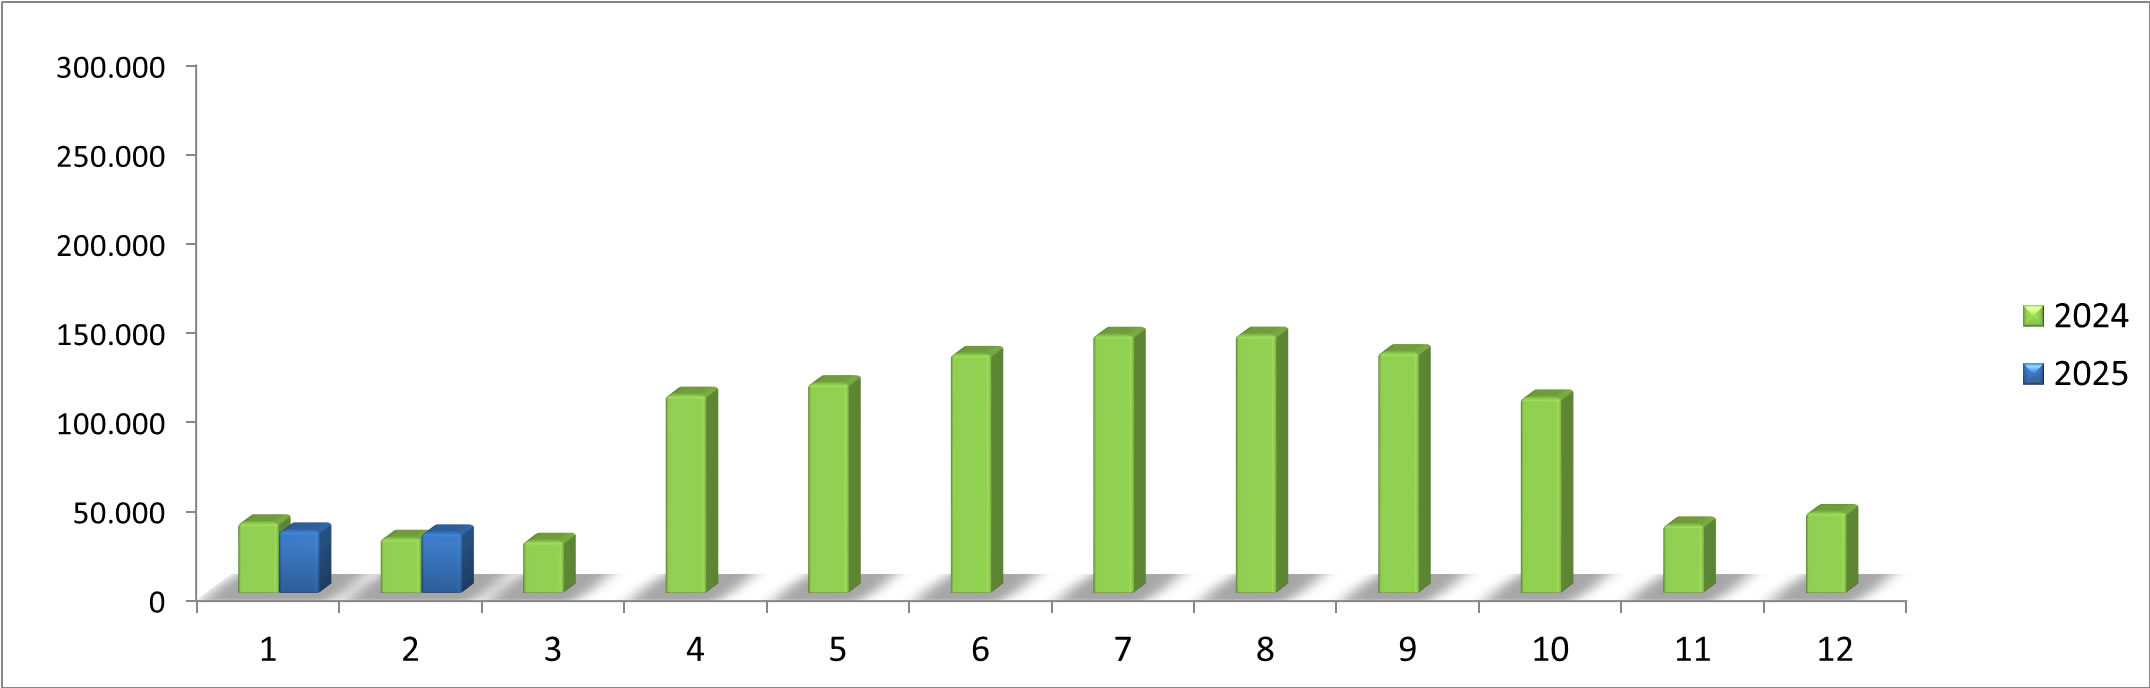
Passenger traffic data for the year 2024: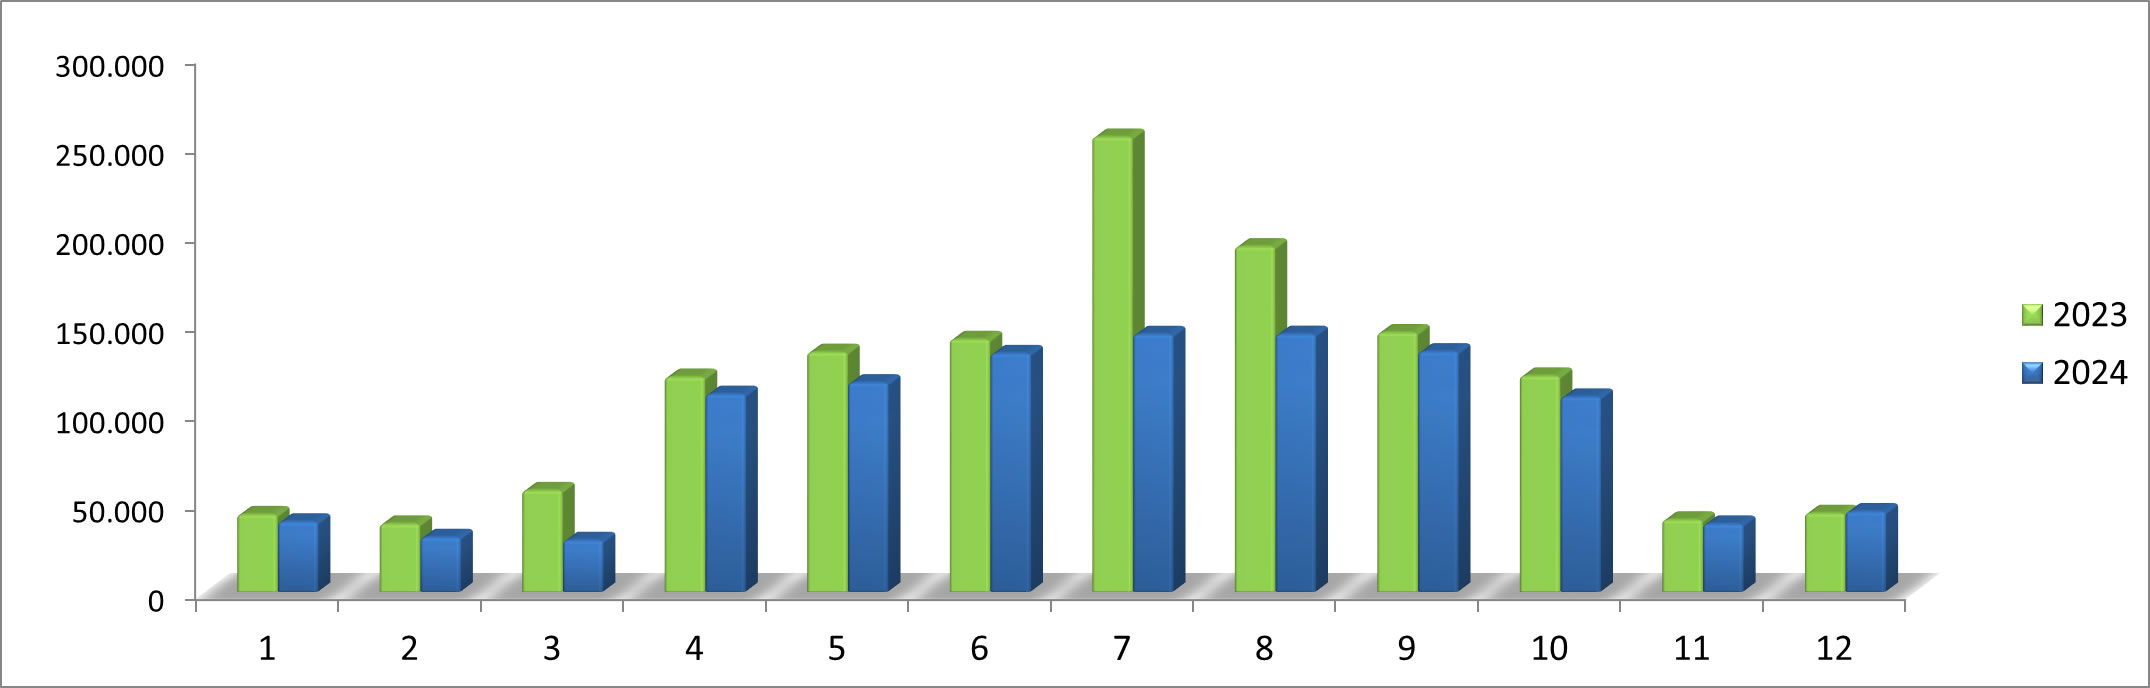
The table shows a comparison between 2023 and 2024 data
| Type of data | 2024 | 2023 | % |
| Number of flights | 9.016 | 10.666 | -15,42% |
| Number of passengers | 1.074.939 | 1.332.368 | -19,32% |
| National flights | 760.797 | 924.174 | -17,68% |
| International flights | 310.191 | 400.964 | -22,64% |
HISTORICAL PASSENGER TREND
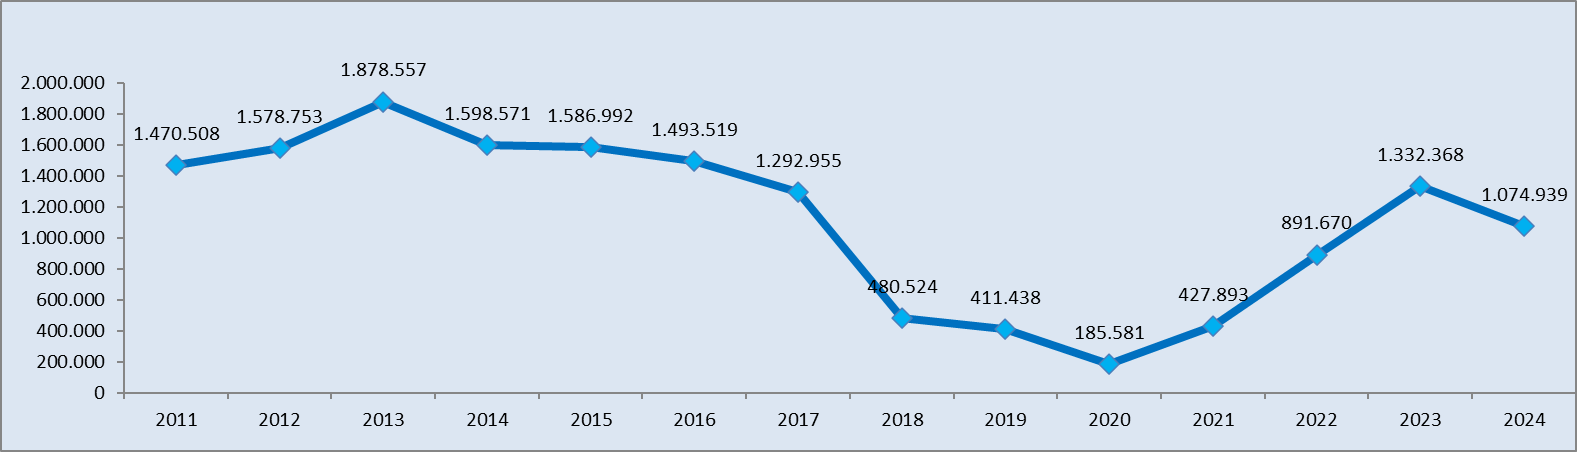
HISTORICAL DATA
The table shows a comparison between 2022 and 2023 data
| Type of data | 2023 | 2022 | % |
| Number of flights | 10.666 | 8.918 | 19.60% |
| Number of passengers | 1.332.368 | 891.670 | 49.42% |
| National flights | 924.174 | 637.212 | 45.03% |
| International flights | 400.964 | 252.980 | 58.50% |
The table shows a comparison between 2016 and 2021 data
| Type of data | 2016 | 2017 | 2018 | 2019 | 2020 | 2021 |
|---|---|---|---|---|---|---|
| Number of flights | 10.858 | 9.559 | 5.961 | 5.333 | 3.224 | 6.068 |
| Number of passengers | 1.493.519 | 1.292.957 | 480.524 | 411.438 | 185.581 | 427.893 |
| National flights | 1.151.515 | 923.284 | 366.801 | 322.218 | 169.165 | 366.841 |
| International flights | 339.785 | 368.062 | 103.324 | 80.732 | 12.343 | 56.894 |
The table shows the comparison between the data recorded since 2010 and those recorded in 2015
| Type of data | 2010 | 2011 | 2012 | 2013 | 2014 | 2015 |
|---|---|---|---|---|---|---|
| Number of flights | 14.833 | 13.218 | 13.438 | 15.838 | 12.536 | 11.607 |
| Number of passengers | 1.682.991 | 1.470.508 | 1.578.753 | 1.878.557 | 1.598.571 | 1.586.992 |
| National flights | 1.024.755 | 918.027 | 1.110.532 | 1.279.972 | 1.159.837 | 1.195.377 |
| International flights | 656.573 | 550.769 | 465.937 | 596.828 | 436.705 | 389.966 |
The table shows the comparison between the data recorded since 2004 and those recorded in 2009
| Type of data | 2004 | 2005 | 2006 | 2007 | 2008 | 2009 |
|---|---|---|---|---|---|---|
| Number of flights | 6.809 | 6.299 | 5.571 | 8.122 | 7.307 | 10.038 |
| Number of passengers | 402.267 | 392.997 | 313.798 | 505.889 | 533.310 | 1.069.528 |